This website uses cookies. By clicking Accept, you consent to the use of cookies. Click Here to learn more about how we use cookies.
Turn on suggestions
Auto-suggest helps you quickly narrow down your search results by suggesting possible matches as you type.
Showing results for
Head's Up! These forums are read-only. All users and content have migrated. Please join us at community.neo4j.com.
- Neo4j
- Community Corner
- General Discussions
- Neo4j Logging/Monitoring with Elastic Cloud and EL...
Options
- Subscribe to RSS Feed
- Mark Topic as New
- Mark Topic as Read
- Float this Topic for Current User
- Printer Friendly Page
Neo4j Logging/Monitoring with Elastic Cloud and ELK Stack
05-22-2019 05:00 PM
Elastic Cloud is frequently used as a monitoring and logging solution; the “ELK Stack” refers to ElasticSearch, LogStash, and Kibana, which are three key components of the Elastic platform. Together, they provide a lot of powerful capabilities for monitoring and dashboarding.
This article will describe how to configure Neo4j logs and metrics to stream effortlessly to an Elastic instance, so you can take advantage of those capabilities. Our approach relies on Elastic’s Beats Platform, which are open source data shippers that you install as agents on your servers to send operational data to Elasticsearch.
Neo4j Logging & Monitoring with Elasticsearch and Kibana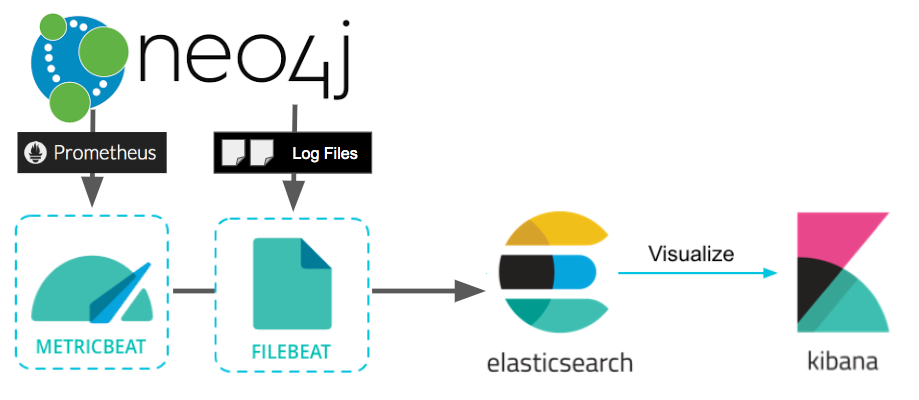
Pre-requisite: Have a Neo4j instance. If you don’t already have one, you can use these directions for GCP to start a new one on Google Cloud.
Pre-requisite: Have an ELK stack instance, or preferably, launch an Elastic Cloud instance.
Logging Setup
Neo4j writes regular files to disk. In order to get the contents of those log files to Elastic on a regular basis, we’ll use a program called filebeat that monitors the files and sends updates to Elastic ongoing.
We’re going to install and configure filebeat by executing the following commands on the Neo4j host.
Install Filebeat
curl -L -O https://artifacts.elastic.co/downloads/beats/filebeat/filebeat-7.1.0-amd64.deb
sudo dpkg -i filebeat-7.1.0-amd64.deb
Configure Filebeat
Edit the configuration file /etc/filebeat/filebeat.yml to point to your Elastic Cloud instance:
cloud.id:  "clustername:CLOUD_ID_HERE"
cloud.auth: "elastic:MYPASSWORD"
This configuration will be a little bit different if you’re pointing to a self-hosted Elastic install, but boy is this route easy and convenient. Make sure that the same configuration file checks for Neo4j logs. Also make sure enabled is set to “true”, since it’s false by default in the file:
- type: log
  enabled: true
  paths:
    - /var/log/neo4j/*
Set up Filebeat and Start the Service
sudo filebeat setup
sudo service filebeat start
At this point, filebeat has created an index for itself, and is streaming log messages to that index. By using the Kibana dashboard, we can see the data coming through — in this example I’m filtering it down to the contents of just one file, “security.log”.
Neo4j’s security.log appearing in Kibana
Logs are good, but what about things like CPU, memory, disk, and Neo4j metrics that we’d want to use to monitor the host?
Host Metrics Setup
First, we’ll need to install metricbeat, which is a collector application that picks up the information off of the host where Neo4j is running and sends it to Elastic Cloud. Really the same thing as filebeat, but for metrics.
Install Metricbeat
curl -L -O https://artifacts.elastic.co/downloads/beats/metricbeat/metricbeat-7.1.0-amd64.deb
sudo dpkg -i metricbeat-7.1.0-amd64.deb
Configure Neo4j to Expose Prometheus Metrics
We’ll also want to grab Neo4j’s built-in metrics (which can be exported by Prometheus) so we will configure Neo4j to do that, by editing neo4j.conf or neo4j.template if you are running a Neo4j Cloud instance, and set these Neo4j settings:
metrics.prometheus.enabled=true
metrics.prometheus.endpoint=localhost:2004
Then, install the prometheus exporter with apt-get install prometheus and configure it by editing /etc/prometheus/prometheus.yml with the following configuration to export Neo4j’s metrics:
scrape_configs:
  - job_name: 'Neo4j-prometheus'
    scrape_interval: 5s
    scrape_timeout: 10s
  static_configs:
      - targets: ['localhost:2004']
Notice how localhost:2004 in the prometheus config matches where Neo4j is publishing metrics. Neo4j exposes an endpoint where a “collector” can scrape metrics, but doesn’t do the scraping itself. That’s why you need to install prometheus server to collect the data, and provide the endpoint that metricbeat needs.
Enable System and Prometheus Modules in Metricbeat
Edit the configuration /etc/metricbeat/metricbeat.yml adding the same parameters as above for filebeat, to tell it how to connect to Elastic. We will then enable the right modules:
sudo metricbeat modules enable system
sudo metricbeat modules enable prometheus
You’ll need to tweak the prometheus module config so that it knows the port that Neo4j prometheus metrics are exposed on. On my system that’s /etc/metricbeat/modules.d/prometheus.yml, where my config looks like this:
- module: prometheus
  period: 10s
  hosts: ["localhost:9100"]
  metrics_path: /metrics
Notice here that the metricbeat plugin is talking to the prometheus exporter, not to the Neo4j prometheus endpoint.
Start the Metricbeat Service
sudo service metricbeat start
Within a few minutes, we should start to see metrics flowing through; these can be visualized with default Kibana dashboards such as the one shown below, by using the metricbeat-* index in Elastic.

What’s Next
With prometheus metrics in play, you can use Kibana to define custom visualizations of those metrics, such as the example below. These individual visualizations then go into the Kibana catalog, where you can start to stack them up to build custom monitoring dashboards.
Kibana Visualization of Neo4j Page Cache Hit Ratio (Prometheus Metric)
Further Resources
- How to configure Prometheus with Neo4j
- Building a Dashboard with Kibana
- Metricbeat documentation
- Filebeat documentation

Neo4j Logging/Monitoring with Elastic Cloud and ELK Stack was originally published in neo4j on Medium, where people are continuing the conversation by highlighting and responding to this story.
Labels:
- Labels:
-
Neo4j-Developer-Blog-Archive
Reply
0 REPLIES 0
Nodes 2022
NODES 2022, Neo4j Online Education Summit
All the sessions of the conference are now available online
Related Content
- GRANDstack - Pulling in data with relationships from Neo4j in to React use Apollo in General Discussions
- Win Big with Neo4j Code Golf – A Cypher Coding Contest in Community News
- Discover Aura Free — Week 27 — GraphConnect Talks in General Discussions
- This Week in Neo4j: Graph Embeddings, OSS Vulnerabilities, Supply Chain Stack, and Star Wars Graph in Community News
- This Week in Neo4j: New Neo4j + Java Course, Intelligent Supply Chain Apps and more in Community News
